
🛠️ Kubernetes Tools Every Engineer Should Be Using — Beyond kubectl
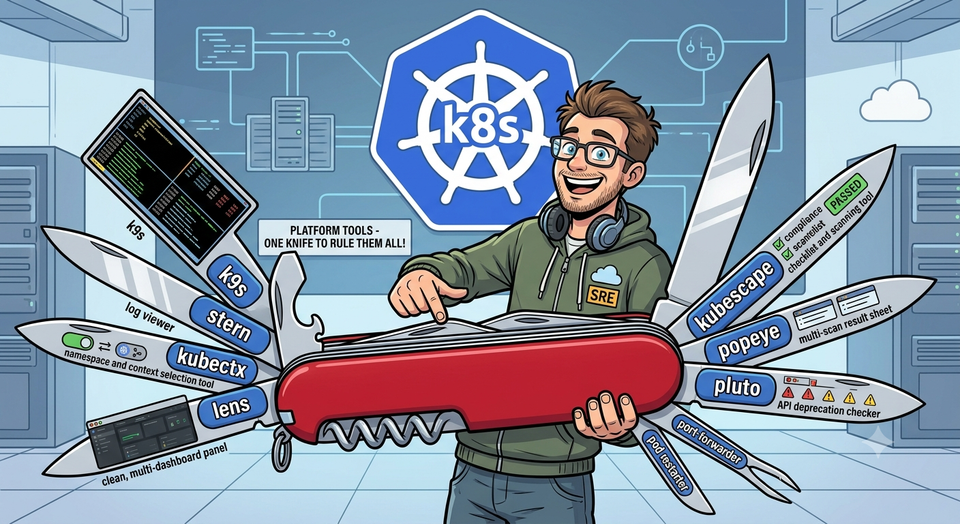
kubectl is just the beginning. Here's what your terminal is missing.
When you first learn Kubernetes, kubectl feels like everything.
And for a while, it is.
But then your cluster grows. You're managing multiple contexts. You're tailing logs across 8 pods simultaneously. You're staring at YAML so dense it makes your eyes water. You're switching namespaces 40 times a day and mistyping the flag every third time.
That's when you realise: kubectl is the foundation. But the engineers who move fast, debug quickly, and stay sane in production — they've built a toolkit around it.
I run Kubernetes professionally on GKE clusters at work, and at home on a 5-node k3s cluster built on Raspberry Pis. These are the tools I actually use, the ones I recommend to every engineer I work with, and a few extras that are worth knowing exist.
Let's go through them one by one.
1. 🔀 kubectx + kubens — Stop Typing Context and Namespace Flags
What it is: Two tiny CLI tools that make switching between Kubernetes contexts and namespaces instant.
Install:
# macOS
brew install kubectx

# Linux
sudo apt install kubectx

# Or via krew (covered below)
kubectl krew install ctx ns
The problem it solves:
Without it, switching context looks like this:
kubectl config use-context gke_myproject_us-central1_prod-cluster
With kubectx:
kubectx prod-cluster
Without it, every command needs a namespace flag:
kubectl get pods -n monitoring
kubectl get pods -n argocd
kubectl get pods -n ghost
With kubens:
kubens monitoring
kubectl get pods   # now always in monitoring namespace
The trick most people miss:
# Switch back to previous context instantly (like cd -)
kubectx -

# Switch back to previous namespace
kubens -

# List all contexts with fuzzy search (install fzf first)
kubectx   # opens interactive picker
If you manage more than one cluster or more than one namespace — this is the first tool you should install. It saves hundreds of keystrokes a day and eliminates an entire class of "why is nothing there" bugs caused by being in the wrong namespace.
2. 🖥️ k9s — A Terminal UI That Changes Everything
What it is: A full terminal-based UI for Kubernetes. Think of it as a real-time dashboard that lives in your terminal and lets you interact with everything using keyboard shortcuts.
Install:
# macOS
brew install k9s

# Linux
curl -sS https://webinstall.dev/k9s | bash

# Or download binary from GitHub releases
What it looks like in practice:
You launch k9s, and immediately you see all your pods with live status, CPU, memory, and restart counts — updating in real time. No more running kubectl get pods -w in one terminal and kubectl top pods in another.
The shortcuts that make it powerful:
:pods          → view all pods
:deployments   → view deployments
:services      → view services
:nodes         → view nodes
:namespaces    → switch namespace
l              → view logs for selected pod
s              → shell into selected pod
d              → describe selected resource
ctrl+d         → delete selected resource
/              → filter/search
?              → help — shows all shortcuts
Real production use cases:
When something breaks, I open k9s, navigate to the broken namespace, find the pod, hit l to see logs — all without typing a single kubectl command. If I need a shell inside the pod, I hit s. If I want to describe it, d.
What used to be 5 separate kubectl commands is now 3 keystrokes.
The other thing k9s does brilliantly: it colour-codes pod health. At a glance, you can see which pods are red (failing), yellow (warning), green (healthy). In a busy cluster with dozens of pods, this visual scan takes 2 seconds instead of reading through a wall of text.
k9s is the single biggest productivity upgrade for Kubernetes engineers. If you install nothing else from this list, install this.
3. 📋 stern — Multi-Pod Log Tailing the Right Way
What it is: A log tailing tool that lets you follow logs from multiple pods simultaneously, with colour-coded output per pod.
Install:
# macOS
brew install stern

# Linux / via krew
kubectl krew install stern
The problem it solves:
kubectl logs only follows one pod at a time. In production, your app might have 5 replicas. When something breaks, the error could be on any of them. You can't tail all 5 simultaneously with kubectl.
With stern:
# Tail all pods matching a name pattern
stern my-app -n production

# Tail across multiple namespaces
stern my-app --all-namespaces

# Tail with a time filter — last 1 hour only
stern my-app --since 1h

# Filter logs by a specific string
stern my-app --include "ERROR"

# Exclude noise you don't need
stern my-app --exclude "health check"
What the output looks like:
Each line is prefixed with the pod name in a unique colour. So if you're tailing 5 replicas, you can instantly see which pod produced which log line. When an error appears, you know immediately which replica is the problem.
my-app-7d4f9b-xkp2q │ 2024-01-15 14:23:01 INFO Request processed
my-app-7d4f9b-mn8qt │ 2024-01-15 14:23:02 ERROR Connection timeout
my-app-7d4f9b-xkp2q │ 2024-01-15 14:23:02 INFO Request processed
my-app-7d4f9b-lp9ws │ 2024-01-15 14:23:03 INFO Request processed
That middle line — immediately visible, colour-coded differently. Without stern, finding this in 5 separate kubectl logs streams would take much longer.
stern is what kubectl logs should have always been.
4. 🔌 krew — The Plugin Manager for kubectl
What it is: The official plugin manager for kubectl. Think of it as brew or apt but specifically for kubectl plugins.
Install:
(
  set -x; cd "$(mktemp -d)" &&
  OS="$(uname | tr '[:upper:]' '[:lower:]')" &&
  ARCH="$(uname -m | sed -e 's/x86_64/amd64/' -e 's/arm.*$/arm/')" &&
  curl -fsSLO "https://github.com/kubernetes-sigs/krew/releases/latest/download/krew-${OS}_${ARCH}.tar.gz" &&
  tar zxvf "krew-${OS}_${ARCH}.tar.gz" &&
  KREW=./krew-"${OS}_${ARCH}" &&
  "$KREW" install krew
)

# Add to PATH in your .bashrc or .zshrc
export PATH="${KREW_ROOT:-$HOME/.krew}/bin:$PATH"
Why it matters:
kubectl has a plugin ecosystem with hundreds of community-built tools. Without krew, finding and installing them manually is painful. With krew:
# Search for plugins
kubectl krew search

# Install a plugin
kubectl krew install neat
kubectl krew install ctx
kubectl krew install ns
kubectl krew install stern
kubectl krew install popeye

# Update all installed plugins
kubectl krew upgrade

# List what you have installed
kubectl krew list
Useful plugins to install immediately:
kubectl krew install ctx          # kubectx functionality
kubectl krew install ns           # kubens functionality
kubectl krew install neat         # clean up verbose YAML output
kubectl krew install stern        # multi-pod log tailing
kubectl krew install popeye       # cluster sanitizer (covered below)
kubectl krew install whoami       # check current auth identity
kubectl krew install konfig       # merge kubeconfigs
Think of krew as the gateway to everything else. Install it first, and everything else becomes one command.
5. 🔭 Lens — The Full Kubernetes IDE
What it is: A desktop application that gives you a full graphical interface for managing Kubernetes clusters. Think k9s but with a GUI, charts, and multi-cluster support.
Install: Download from k8slens.dev
What it does:
- Connect multiple clusters and switch between them instantly
- Real-time resource usage charts per node and per pod
- Browse and edit any Kubernetes resource with a built-in YAML editor
- Stream logs from any pod with one click
- Shell into pods directly from the UI
- View Helm releases and their status
- Port-forward services with a button click
When to use Lens vs k9s:
| Situation | Use |
|---|---|
| Daily terminal workflow | k9s |
| Showing cluster status to non-engineers | Lens |
| Multi-cluster overview at a glance | Lens |
| Quick debugging during an incident | k9s |
| Onboarding a new team member | Lens |
| Running on a remote server | k9s (terminal only) |
Lens is particularly useful when you need to share cluster state with someone who isn't comfortable with the terminal — product managers, leadership, or junior engineers just getting started. The visual charts and clean UI make it approachable.
Note: Lens has a free and paid tier. The free tier (OpenLens, the open source fork) covers everything most engineers need.
6. 🧹 Popeye — Your Cluster Sanitizer
What it is: A tool that scans your live Kubernetes cluster and reports issues, misconfigurations, and best practice violations.
Install:
# Via krew
kubectl krew install popeye

# Or binary
brew install popeye
Run it:
# Scan entire cluster
kubectl popeye

# Scan specific namespace
kubectl popeye -n production

# Output as HTML report
kubectl popeye -o html > cluster-report.html
What it catches:
Popeye grades your cluster from A to F and reports issues like:
💥 Deployments with no resource limits set
💥 Services with no matching endpoints (orphaned services)
💥 Pods running as root
💥 Missing liveness or readiness probes
💥 ConfigMaps that nothing is using
💥 Secrets that nothing is referencing
💥 Containers using :latest image tags
💥 Containers with deprecated API versions
Real value in production:
Run Popeye on a cluster you've inherited or one that's been running for a while — the results are usually humbling. Things that slipped through during rapid development, configs that were "temporary", services nobody cleaned up — Popeye surfaces all of it.
I run it monthly on my homelab cluster and it consistently catches something I forgot about. In production environments, running it as part of a regular audit is genuinely valuable.
7. 🎨 kubecolor — Make kubectl Output Actually Readable
What it is: A wrapper around kubectl that adds colour to the output. Sounds trivial. Makes a real difference.
Install:
# macOS
brew install kubecolor

# Linux
go install github.com/kubecolor/kubecolor@latest
Setup — alias it to replace kubectl:
# Add to .bashrc or .zshrc
alias kubectl=kubecolor
alias k=kubecolor
Before kubecolor:
NAME                    READY   STATUS    RESTARTS   AGE
ghost-7d4f9b-xkp2q     1/1     Running   0          5d
broken-pod-mn8qt        0/1     Error     15         2h
pending-pod-lp9ws       0/1     Pending   0          10m
After kubecolor:
- Running pods → green
- Error pods → red
- Pending pods → yellow
- Age, restarts, ready counts all colour-coded
When you're scanning a namespace with 30 pods, the colour difference between Running and Error jumps out instantly. Without colour, your eyes have to read every STATUS column. With kubecolor, the red ones scream at you.
Small tool. Zero learning curve. Install it and forget about it — it just works.
8. 🌐 Telepresence — Debug Local Code Against a Real Cluster
What it is: A tool that lets you run a service locally on your laptop but have it behave as if it's inside the Kubernetes cluster — with full access to cluster services, secrets, and environment variables.
Install:
# macOS
brew install datawire/blackbird/telepresence

# Linux
sudo curl -fL https://app.getambassador.io/download/tel2/linux/amd64/latest/telepresence -o /usr/local/bin/telepresence
sudo chmod a+x /usr/local/bin/telepresence
The problem it solves:
The classic development pain: your service works locally but behaves differently in the cluster because it can't reach other cluster services, doesn't have the right environment variables, or behaves differently under the cluster's networking.
With Telepresence:
# Connect to your cluster
telepresence connect

# Intercept traffic meant for a service and redirect it to your local machine
telepresence intercept my-service --port 8080

# Now run your local version of the service
node server.js  # or whatever starts your app locally
Traffic that would normally go to my-service inside the cluster now goes to your local machine. Your local code can reach every other service in the cluster by name. You can set breakpoints, change code, and see the effects immediately — without building a Docker image or pushing to a registry.
When it's invaluable:
Debugging a subtle production issue where you need to step through code but can't reproduce it locally because it depends on cluster-internal services. Telepresence collapses the distance between your laptop and the cluster.
9. 🔐 Kubescape — Security Scanning for Your Cluster
What it is: An open source Kubernetes security scanner that checks your cluster and manifests against security frameworks like NSA/CISA guidelines, MITRE ATT&CK, and CIS benchmarks.
Install:
# macOS / Linux
curl -s https://raw.githubusercontent.com/kubescape/kubescape/master/install.sh | /bin/bash
Run it:
# Scan your entire cluster
kubescape scan

# Scan against a specific framework
kubescape scan framework nsa

# Scan local YAML files before applying them
kubescape scan *.yaml

# Get a risk score with detailed breakdown
kubescape scan --format pretty-printer
What it catches:
⚠️  Containers running as root
⚠️  Missing network policies
⚠️  Overly permissive RBAC roles
⚠️  Secrets mounted as environment variables (instead of volumes)
⚠️  Privileged containers
⚠️  Missing pod security contexts
⚠️  API server exposure risks
Why this matters more than people realise:
Most teams focus on application security and forget about cluster security. A perfectly secure app running in a misconfigured cluster is still a security incident waiting to happen. Kubescape gives you a concrete score and a prioritised list of what to fix.
Run it on a cluster that's been running in production for a year. The results will motivate you to schedule a security cleanup sprint.
10. ⚰️ Pluto — Find Deprecated and Removed API Versions Before They Break You
What it is: A tool that detects deprecated and removed Kubernetes API versions in your manifests, Helm charts, and running cluster — before a Kubernetes upgrade breaks everything.
Install:
# macOS
brew install FairwindsOps/tap/pluto

# Linux
curl -L https://github.com/FairwindsOps/pluto/releases/latest/download/pluto_linux_amd64.tar.gz | tar xz
sudo mv pluto /usr/local/bin/
Run it:
# Scan files in a directory
pluto detect-files -d ./k8s/

# Scan a Helm release
pluto detect-helm -n my-namespace

# Scan the live cluster
pluto detect-api-resources

# Check what's deprecated for a specific K8s version you're upgrading to
pluto detect-files -d ./k8s/ --target-versions k8s=v1.29.0
Why this is critical before a cluster upgrade:
Kubernetes regularly removes deprecated API versions. extensions/v1beta1 was removed in 1.16. networking.k8s.io/v1beta1 in 1.22. If you have manifests or Helm charts still using these — the moment you upgrade your cluster, they stop working.
Without Pluto, you find this out when the upgrade is done and nothing deploys. With Pluto, you find it before you upgrade and fix it first.
Run Pluto before every cluster version upgrade. No exceptions.
🗂️ Quick Reference — The Full Toolkit
| Tool | What It Does | Install |
|---|---|---|
| kubectx + kubens | Switch contexts and namespaces instantly | brew install kubectx |
| k9s | Terminal UI for everything | brew install k9s |
| stern | Multi-pod log tailing | kubectl krew install stern |
| krew | kubectl plugin manager | GitHub install script |
| Lens | Full desktop GUI for clusters | k8slens.dev |
| Popeye | Cluster health and misconfiguration scanner | kubectl krew install popeye |
| kubecolor | Colourised kubectl output | brew install kubecolor |
| Telepresence | Local dev against real cluster | brew install telepresence |
| Kubescape | Security scanning against frameworks | curl install script |
| Pluto | Deprecated API version detection | brew install pluto |
💬 Final Thought
kubectl gets you into the cluster. These tools keep you sane once you're there.
The difference between an engineer who fights Kubernetes and one who works with it smoothly is usually not knowledge — it's tooling. The right tools collapse the feedback loop, surface problems faster, and remove the friction that makes debugging feel like archaeology.
Start with k9s and kubectx. They'll change your daily workflow immediately. Add stern when you're managing multi-replica workloads. Run Popeye and Kubescape when you want to know the honest state of your cluster. Install Pluto before every upgrade.
Build the toolkit once. Use it forever.
I write about DevOps, Kubernetes, platform engineering, and real infrastructure at:
— Satya 👨💻 Platform Engineer | GKE | k3s | GitOps | Always adding one more tool to the toolkit
📌 Also on Medium: Follow me there for cross-posted versions of every article. 📌 Next post: AdGuard Home on k3s — DNS-level ad blocking with real Kubernetes manifests. Follow RootBySatya to get notified.
Member discussion